
By now many of you will have had a chance to enjoy Ashridge South and East in the spring sunshine. You will have encountered the large areas of wonderful white forest scattered with earth features, as well as the equally large areas of bramble that may still contain earth features but nobody has been brave enough to venture in to find out.
This bramble that now covers about half the area of the map has grown up in the five years since the last event we held there, at which time the map was almost entirely white. After my first few days in the forest I was despairing that we could even hold an event and there was a crisis Zoom meeting with Organiser, Planner and Controller to decide if we could proceed.
It was the bramble growth that finally determined that we needed a completely new map for this event. The various bits of Ashridge have been through many mapping cycles, but are slightly dodgy in places where things have been stretched or squashed over time to get various bits to line up. This is a well-known problem with orienteering maps that date back to Ordnance Survey base maps and have been gradually modified over a long period. I had attempted to georeference the old maps but with limited success. This was a chance to start completely afresh.
The new gold standard for base maps is Lidar (light detection and ranging) which is generated by a laser survey from an aircraft. Much of the country has been surveyed by the Environment Agency, and they now make the data available for free as part of the UK Government Open Data initiative. Historically this has focussed on rivers, flood plains and coastlines which left large parts of the country devoid of data, including many parts of Hertfordshire. There was a commitment to cover the whole country by the end of 2021, and whilst this date has inevitably slipped there are still new areas being released. One of these turned out to be Ashridge.
The data files are very large and essentially consist of a series of points over a grid, with details of what got reflected back at each point. This can include multiple signals where you may be getting reflection off the ground itself, off the top layer of vegetation and even off of objects somewhere between the ground and the treetops. The grid size determines how good the base map will be from an orienteering mapping point of view. Initially this was set to 2m but newer data is at 1m which produces a significant improvement.
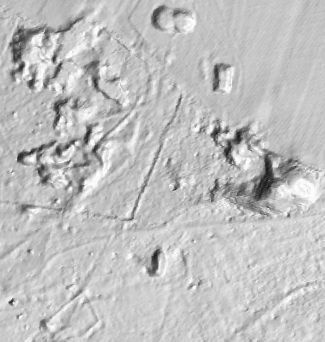 Figure 1: DTM hill shading
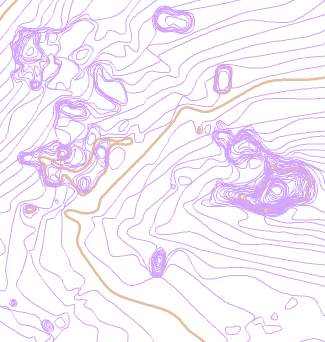 Figure 2: 0.25m contours
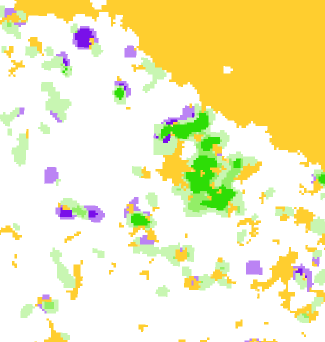 Figure 3: Vegetation map
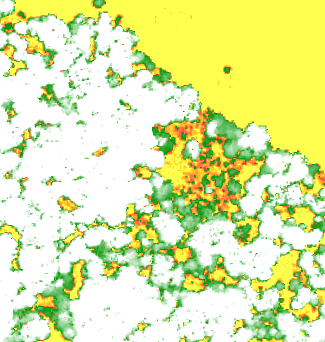 Figure 4: Height above ground
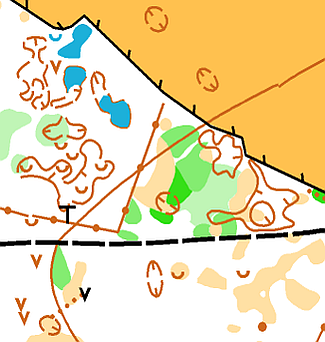 Figure 5: Ashridge 2017 map
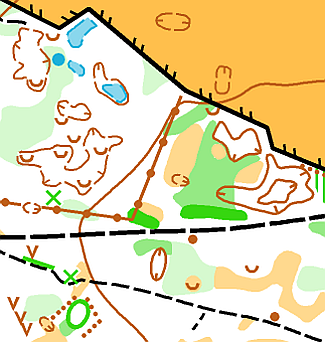 Figure 6: Ashridge 2022 map
Figure 1 shows the hill shading generated from the Digital Terrain Model (DTM), which is the extracted ground surface with all vegetation and buildings removed. This clearly shows earthbanks, ditches and depressions and can also give clues about ground cover: compare the smooth texture of the open fields to the more mottled woodland for example. You can play around with the direction and angle of the lighting to see what turns up.
Figure 2 shows automatically generated contours for the same area with the contour interval set to 0.25m.
Figure 3 shows an automatically generated vegetation map. Greens and yellows are as on a normal orienteering map. The purple indicates areas of ground vegetation.
Figure 4 uses the difference between the DTM and the Digital Surface Model (DSM) to classify the height of buildings and vegetation. Yellows show very low ground cover, greens are up to 2 metres, and white is anything over that.
And finally Figures 5 and 6 show extracts of the maps from 2017 and 2022.
Most orienteering maps are drawn using a specialist program called OCAD produced by a Swiss company. This includes an extremely powerful tool that allows the import of Lidar data and conversion to formats useful for mapping. These are in the form of background maps that can be used to trace over, as well as to identify things that need to looked at when surveying.
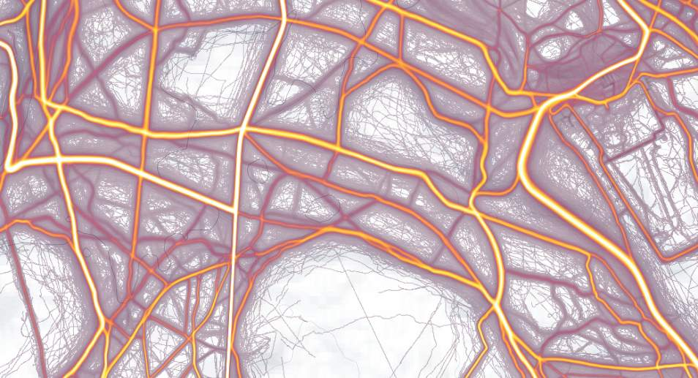
And for a non-Lidar source, Figure 7 shows an extract from the Strava Heatmap of Ashridge. This combines the GPS uploads from the thousands of Strava users and colour-codes them to show the most heavily used paths. This proved useful to at least highlight where paths might be.
All of this technology means you can spend a very long time sitting at home drawing a base map to start from. The problem is that an orienteering map needs to show what it looks like when you run through an area. In many cases this requires a lot of simplification and interpretation, and you certainly cannot rely on what the Lidar provides. Many features that appear to show up on Lidar are essentially invisible on the ground, whilst other things that are completely missing from Lidar look enormous in the forest. Things will also have changed since the Lidar was generated: vegetation grows up very quickly and paths emerge or disappear. The only solution is to get out there and walk round the whole area. In all I visited eight times and spent just over 37 hours mapping. In that time I walked a distance of just over 120km with 1100m of climb.
Now that the south and east are done it just remains to remap the area north past Monument Drive and up towards Ivinghoe Beacon. The bad news is that there are reports of lots of bramble up there as well. The good news is that I have Lidar for the base map.
